
Cite as: DOI
10.25815/xbvj-xa70
Citation format: The Chicago Manual of Style, 17th Edition
DeCarolis, Joseph. ‘Modeling Low Carbon Energy Futures for the United States’, 2019. https://doi.org/10.25815/xbvj-xa70.
A new project will create an Open Energy Outlook for the United States to complement the US Annual Energy Outlook, which produces modeled projections of domestic energy markets. The Open Energy Outlook will utilize an open source energy system optimization model to examine US technology and policy pathways for deep decarbonization. Energy models provide a self-consistent framework to evaluate the effects of technology innovation, shifts in fuel prices, and new energy and climate policies. The focus on open source code and data is intended to foster community involvement in the effort, allow researchers to interrogate the model and reproduce published results, and engender trust within the broader community of modelers, analysts, and decision makers. The project has been funded by the Sloan Foundation.
I begin with a description of energy system optimization models (ESOMs), which are used to assist with long-term energy planning. I then describe my experience building and utilizing Tools for Energy Model Optimization and Analysis (Temoa), an open source ESOM.
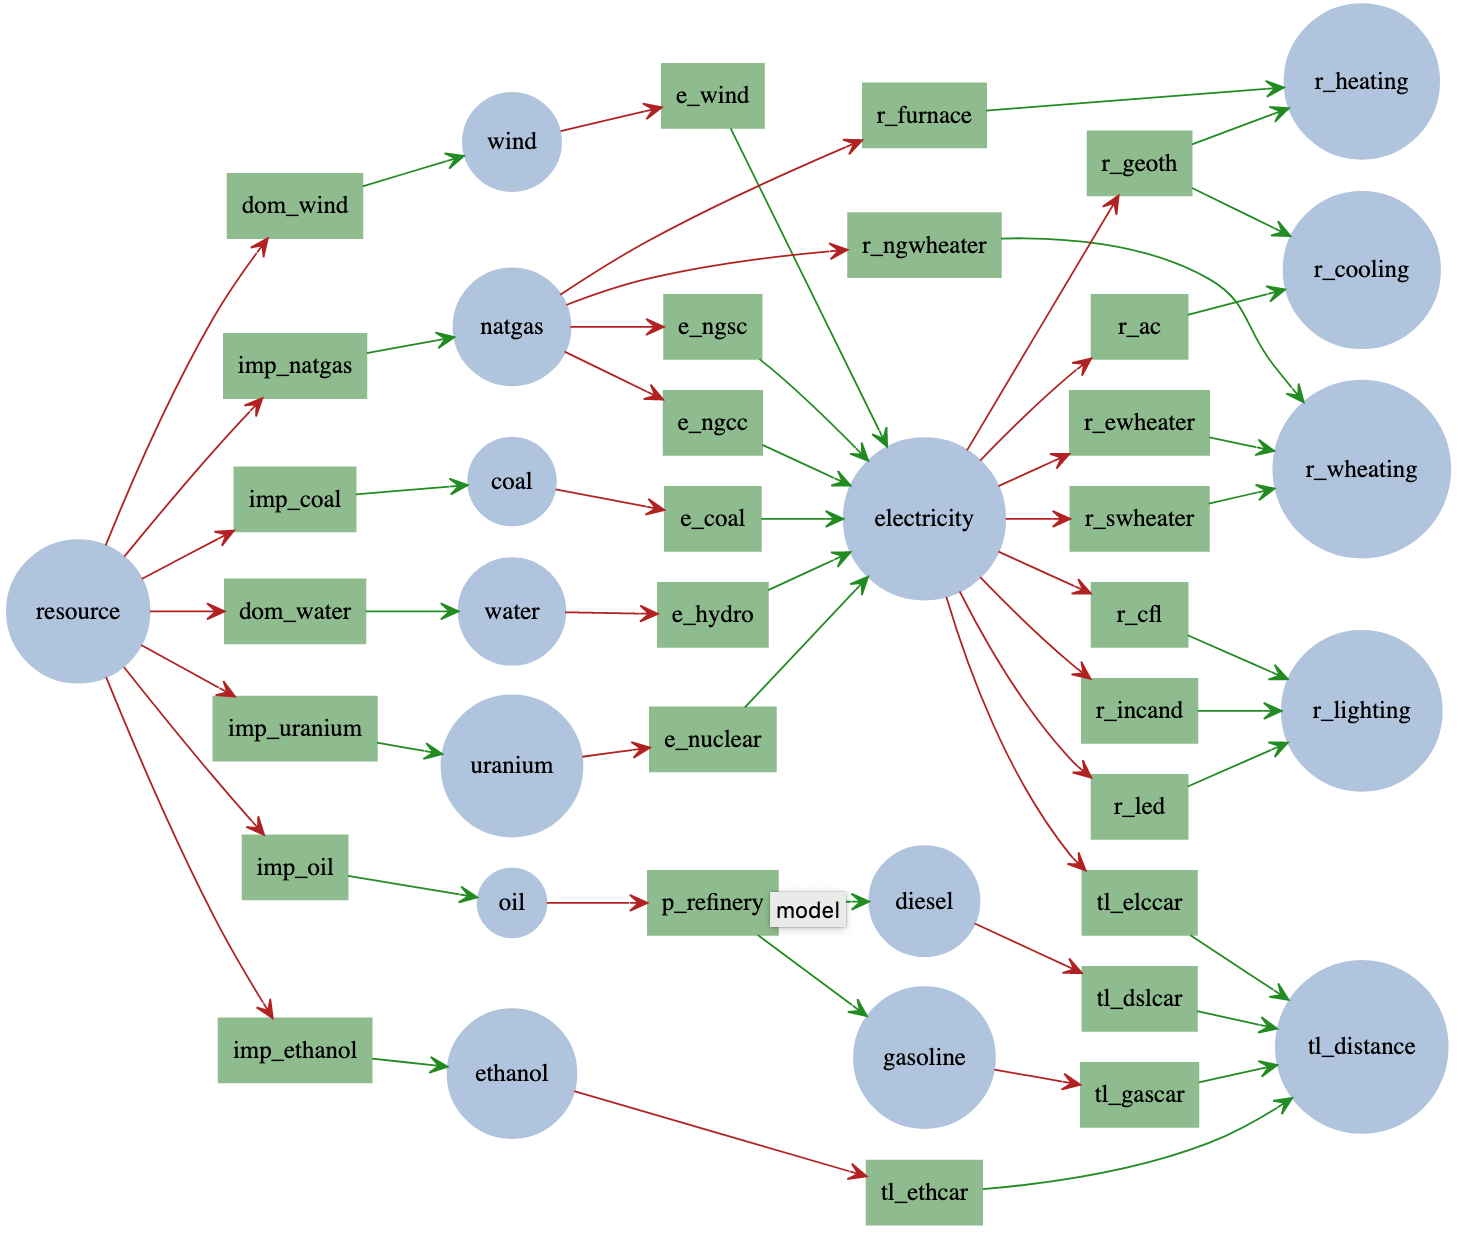
Energy system optimization models (ESOMs) are often used to explore alternative energy futures under a variety of different assumptions pertaining to fuel prices, technology innovation, demand growth, and proposed energy and climate policies. Such model-based analysis has been used to inform government policy discussions at scales ranging from local to global. ESOMs minimize the system-wide cost of energy supply by optimizing the installed capacity and utilization of energy technologies across the system and through time. Input data includes a representation of the energy system network (Figure 1). Each technology in the network is characterized by a capital cost, operations and maintenance costs, conversion efficiency, and emissions coefficients. Fuel prices can be represented with a fixed price trajectory over time, or through a series of price steps, such that increasing consumption in a given time period leads to price increases. These models include a set of constraints that ensure that input and output commodity flows balance across individual technologies as well as the entire system. ESOMs also allow for user-defined constraints, including minimum and maximum bounds on technology production, capacity, and emissions. An important feature of ESOMs is that the model code governing system dynamics is distinct from the input datasets. Thus, one can build independent datasets with different temporal and geographic resolution and use the same model to solve it. Once the model is instantiated, the actual optimization must be performed by a solver. There are both commercial and open source solvers that can be used, however, commercial solvers such as CPLEX and Gurobi have much better performance.
When I started my faculty position in 2008, I began to realize the difficulty of doing energy system modeling in an academic environment where licensing costs are high and many modeling groups were unwilling to share their models and data. I resolved to address these challenges by building a new model from scratch, making all code and data open source. Our team at North Carolina State University began building Tools for Energy Model Optimization and Analysis (Temoa) as an open source ESOM in 2009. I enlisted two graduate students with a background in computer science to begin model development. Around the same time, Sandia National Laboratory produced an early version of Pyomo, an open source, Python-based implementation of an algebraic modeling language. In addition to making code and data open source, we wanted to use an open source software stack in order to minimize the financial barriers to entry. Thus Pyomo was a logical choice. At the time, very few energy models were open source. Temoa was developed with two objectives in mind:
- make model source code and data open source, and
- develop a toolkit to better quantify the role of uncertainty in ESOM-based analysis.
I viewed it as important to make model source code and data open source for a couple reasons. First, there is a lot of duplicative effort in constructing models and datasets. The community benefits by sharing its work. Second, model-based analysis used to inform policy should be repeatable by third parties. If energy modeling is to follow basic scientific convention, then it should be possible to replicate published results. With respect to uncertainty analysis, the energy modeling community needs to do a better job characterizing how future uncertainty can affect key model-based insights. To this end, Temoa was designed to operate efficiently in a high performance computing environment to enable a large number of model iterations, and our team has been adding the functionality to characterize uncertainty in different ways.
In the summer of 2019, Paulina Jaramillo (Carnegie Mellon) and I received funding from the Sloan Foundation to develop an Open Energy Outlook for the United States. This project will apply the gold standards of policy-focused academic modeling, maximize transparency, and build a team that works toward a common goal: examining alternative U.S. energy pathways to inform future energy and climate policy efforts. We will utilize Temoa and focus on the development of technology and policy pathways to enable deep decarbonization. The project has been funded for three years, and will be convening annual workshops with invited guests to think through the modeling approach and data. In addition, we plan to make this a community effort by soliciting advice and feedback from the broader community of energy modelers and analysts.
In addition to making sure that our data and methodological approach are sound, we want to make the modeling work associated with the Open Energy Outlook as transparent as possible. We plan to build on our existing practices with Temoa. To begin, all of the model code and data is already available in a set of GitHub repositories. However, there is much more to transparency than simply making the model publicly available. The model formulation is complex, the input datasets are large, and the model requires several distinct software elements to operate. So the quest to be transparent doesn’t end simply making the model available. Rather, we view transparency as a long-term commitment to making the model as accessible and understandable as possible.
We also realized that the process of setting up the software environment manually was cumbersome, so we developed an environment file that utilizes Conda to automatically set up a Python-based Temoa environment with software versions that we know work with the latest version of our code. To better document the model, we embed comment blocks (i.e., docstrings) inside the model code and use Sphinx to dynamically generate the model documentation by parsing these comments. This helps to ensure that the model documentation remains up-to-date.
While replication of past analysis might seem straightforward with all relevant files available on GitHub, the model code and data specifications change over time, which can result in incompatibilities between specific versions of code and data. To remedy this, we archive snapshots of Temoa code and data used to produce particular analyses with Zenodo, a public repository for open science projects operated by CERN. When uploading project files, zenodo also generates a document object identifier (DOI), which provides a convenient way to reference the files and allows for easier tracking (via Twitter and altmetrics). For this new project, we are in the process of thinking through how to better document the input datasets. One possibility is to use Jupyter Notebooks, which can query our input database and dynamically render tables of input data along with the appropriate documentation.
Our focus on transparency is intended to create a welcoming community, inspire contributions, and provide a modeling platform that allows users to perform their own analysis with low barriers to entry. If you’re interested to learn more about the project, send me a note.
Project info
This project will utilize an open source energy system model to create an Open Energy Outlook for the United States.
Temoa (Tools for Energy Model Optimization and Analysis) is a modern, open source software platform for modeling energy systems. Developed by Joe DeCarolis and his team at North Carolina State University.
The report will outline how the United States can transition to a low carbon energy system over the coming decades, including detailed consideration of how policy and economics as well as sector specific developments in buildings, electricity, fuels, heavy industry, and transportation might contribute to that transition.
Relevant links
Temoa website: http://temoaproject.org/
GitHub repos: https://github.com/TemoaProject/
Zenodo repos: https://zenodo.org/search?page=1&size=20&q=temoaproject
Cloud-based version of Temoa: http://model.temoacloud.com/
Acknowledgement
Thank you to Chris Erdmann in initiating the blogpost contribution to GenR and input on its writing.
*Image info
Source: Estimated U.S. Energy Consumption in 2018: 101.2 Quads. LLNL March 2019. Data is based on DOE/EIA MER (2018). If this information or a reproduction of it is used, credit must be given to the Lawrence Livermore National Laboratory and the Department of Energy, under whose auspices the work was performed. Distributed electricity represents only retail electricity sales and does not include self-generation. EIA reports consumption of renewable resource (i.e., hydro, wind, geothermal and solar) for electricity in BTU-equivalent values by assuming a typical fossil fuel plant heat rate. End use efficiency is estimated as 65% for the residential sector, 65% for the commercial sector, 21% for the transportation sector and 49% for the industrial sector, which was updated in 2017 to reflect DOE’s analysis of manufacturing. Totals may not equal sum of components due to independent rounding. LLNL-MI-410527. URL: https://flowcharts.llnl.gov/


Recent comments